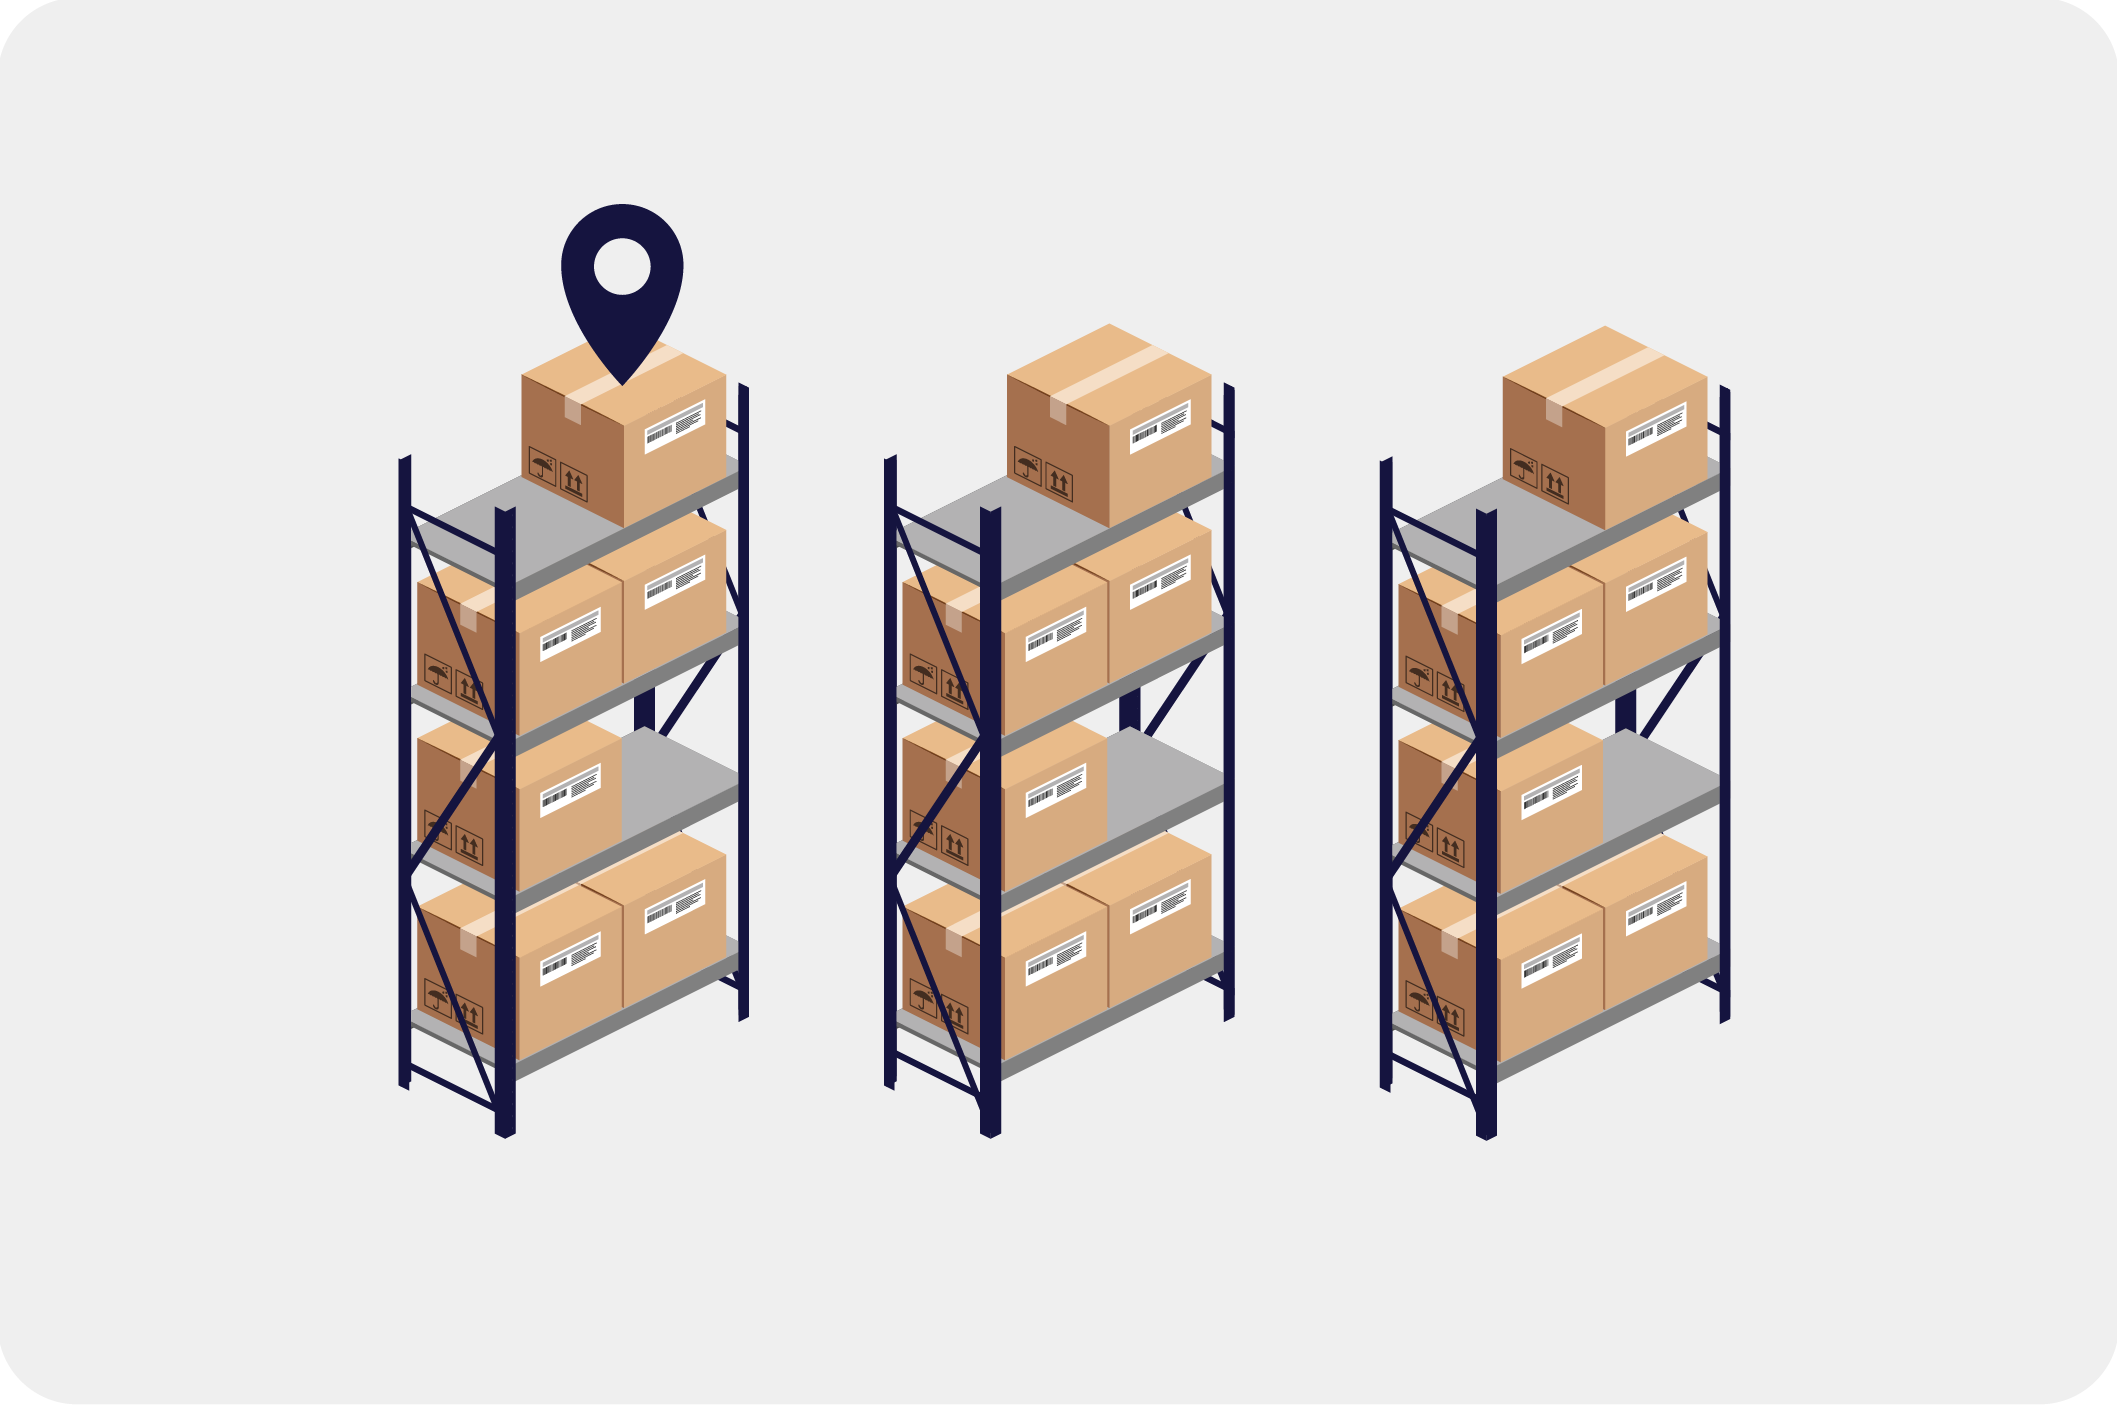
Want to see what your inventory looked like at a specific point in time? The Counts report can show stock levels on a selected date, so you can work more accurately with historical data and follow-ups.
Filter by products, product groups, and locations
You can customize Counts so you only see what’s relevant — for example:
1. Selected products
2. A specific product group
3. Stock levels for one location
4. Stock levels per location, if you work with multiple warehouses
Identify slow-moving items and clean up your inventory
Counts makes it easier to spot items that aren’t moving. You can, for example:
1. Exclude products with no transactions in a selected period
2. Hide “empty items”, so you only see products with a positive stock level
This gives you a clearer picture of what you actually have in stock.